By Ross Moody, IPWEA Executive Manager
Recent discussion on the IPWEA Fleet & Plant Management forum highlighted the differing opinions on the best time to changeover vehicles.
Surprisingly there are still organisations changing at two years/40,000 kilometres, which was the norm in the days of sales tax exemption for government. Many have adopted three years/60,000km or 80,000km, and few have ventured beyond manufacturer’s warranty.

The decision of when to change over the light fleet should be based on optimum replacement timing, which is calculated to best estimate the optimum timing (in kilometres travelled and time) to achieve the lowest average annual cost during the life of the vehicle.
When graphed, depreciation figures will show two distinct steep drops in resale value. The first significant drop is immediately post purchase, the second drop is prior to a major component overhaul, which is when second-hand buyers are aware of a large impending maintenance bill.
Refer to the graph below as an example, provided for demonstration purposes only. The green line represents maintenance/downtime, the white line represents depreciation, and the red line represents average cost.
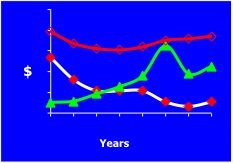
The optimum replacement point in the life of the vehicle is the lowest point on the average cost curve, which is near when the decreasing line of depreciation intersects with the increasing cost of repairs and maintenance costs.
The light vehicle whole-of-life cost comparison charts generated from the light fleet selection model available to Systems Plus subscribers on the IPWEA website consistently indicate lowest-cost changeover occurs after five years.
The average annual costs of up to 10 vehicles can be compared in a single chart. The charts are drawn from an extensive database of 190 vehicles where whole-of-life costs are updated quarterly. The charts also provide a guide to each vehicle’s optimum changeover year by providing a whole-of-life cost comparison of changing a vehicle at one, two, three, four or five years, based on a selected average annual utilisation. With few exceptions, the lowest-cost changeover occurs after five years.
Comparison of Cars showing lowest cost year and average annual costs
The chart below shows the average annual cost of a range of small cars travelling 20,000km per year, if they are changed over at one, two, three, four or five years. The chart shows that the average annual cost is lowest if the vehicles are held for five years. The chart also shows a comparison of average annual costs between each make/model. The lowest-cost cars in this group are the Honda Jazz and Toyota Yaris.

Visit www.ipwea.org/fleet for access to the model and other online fleet management tools. Access is available on an annual subscription basis.