The challenges of operating a vital, $5 billion asset network servicing more than 1.4 million residents are now being met with the help a sophisticated data crunching system.
Queensland Urban Utilities has begun rolling out Q-Hubs, an online geographic information systems (GIS) portal, which uses data collected through legacy systems to provide staff with a holistic, real-time visualisation of operations, allowing QUU to react proactively and plan for any number of potential situations.
There is a whole lot of data for the system to crunch. QUU’s asset network supplies upwards of 136,000ML of water and removes 124,600ML of sewerage for residents across South East Queensland each year. In 2015, QUU responded to more than 24,000 written customer inquiries, and took more than 290,000 customer phone calls.

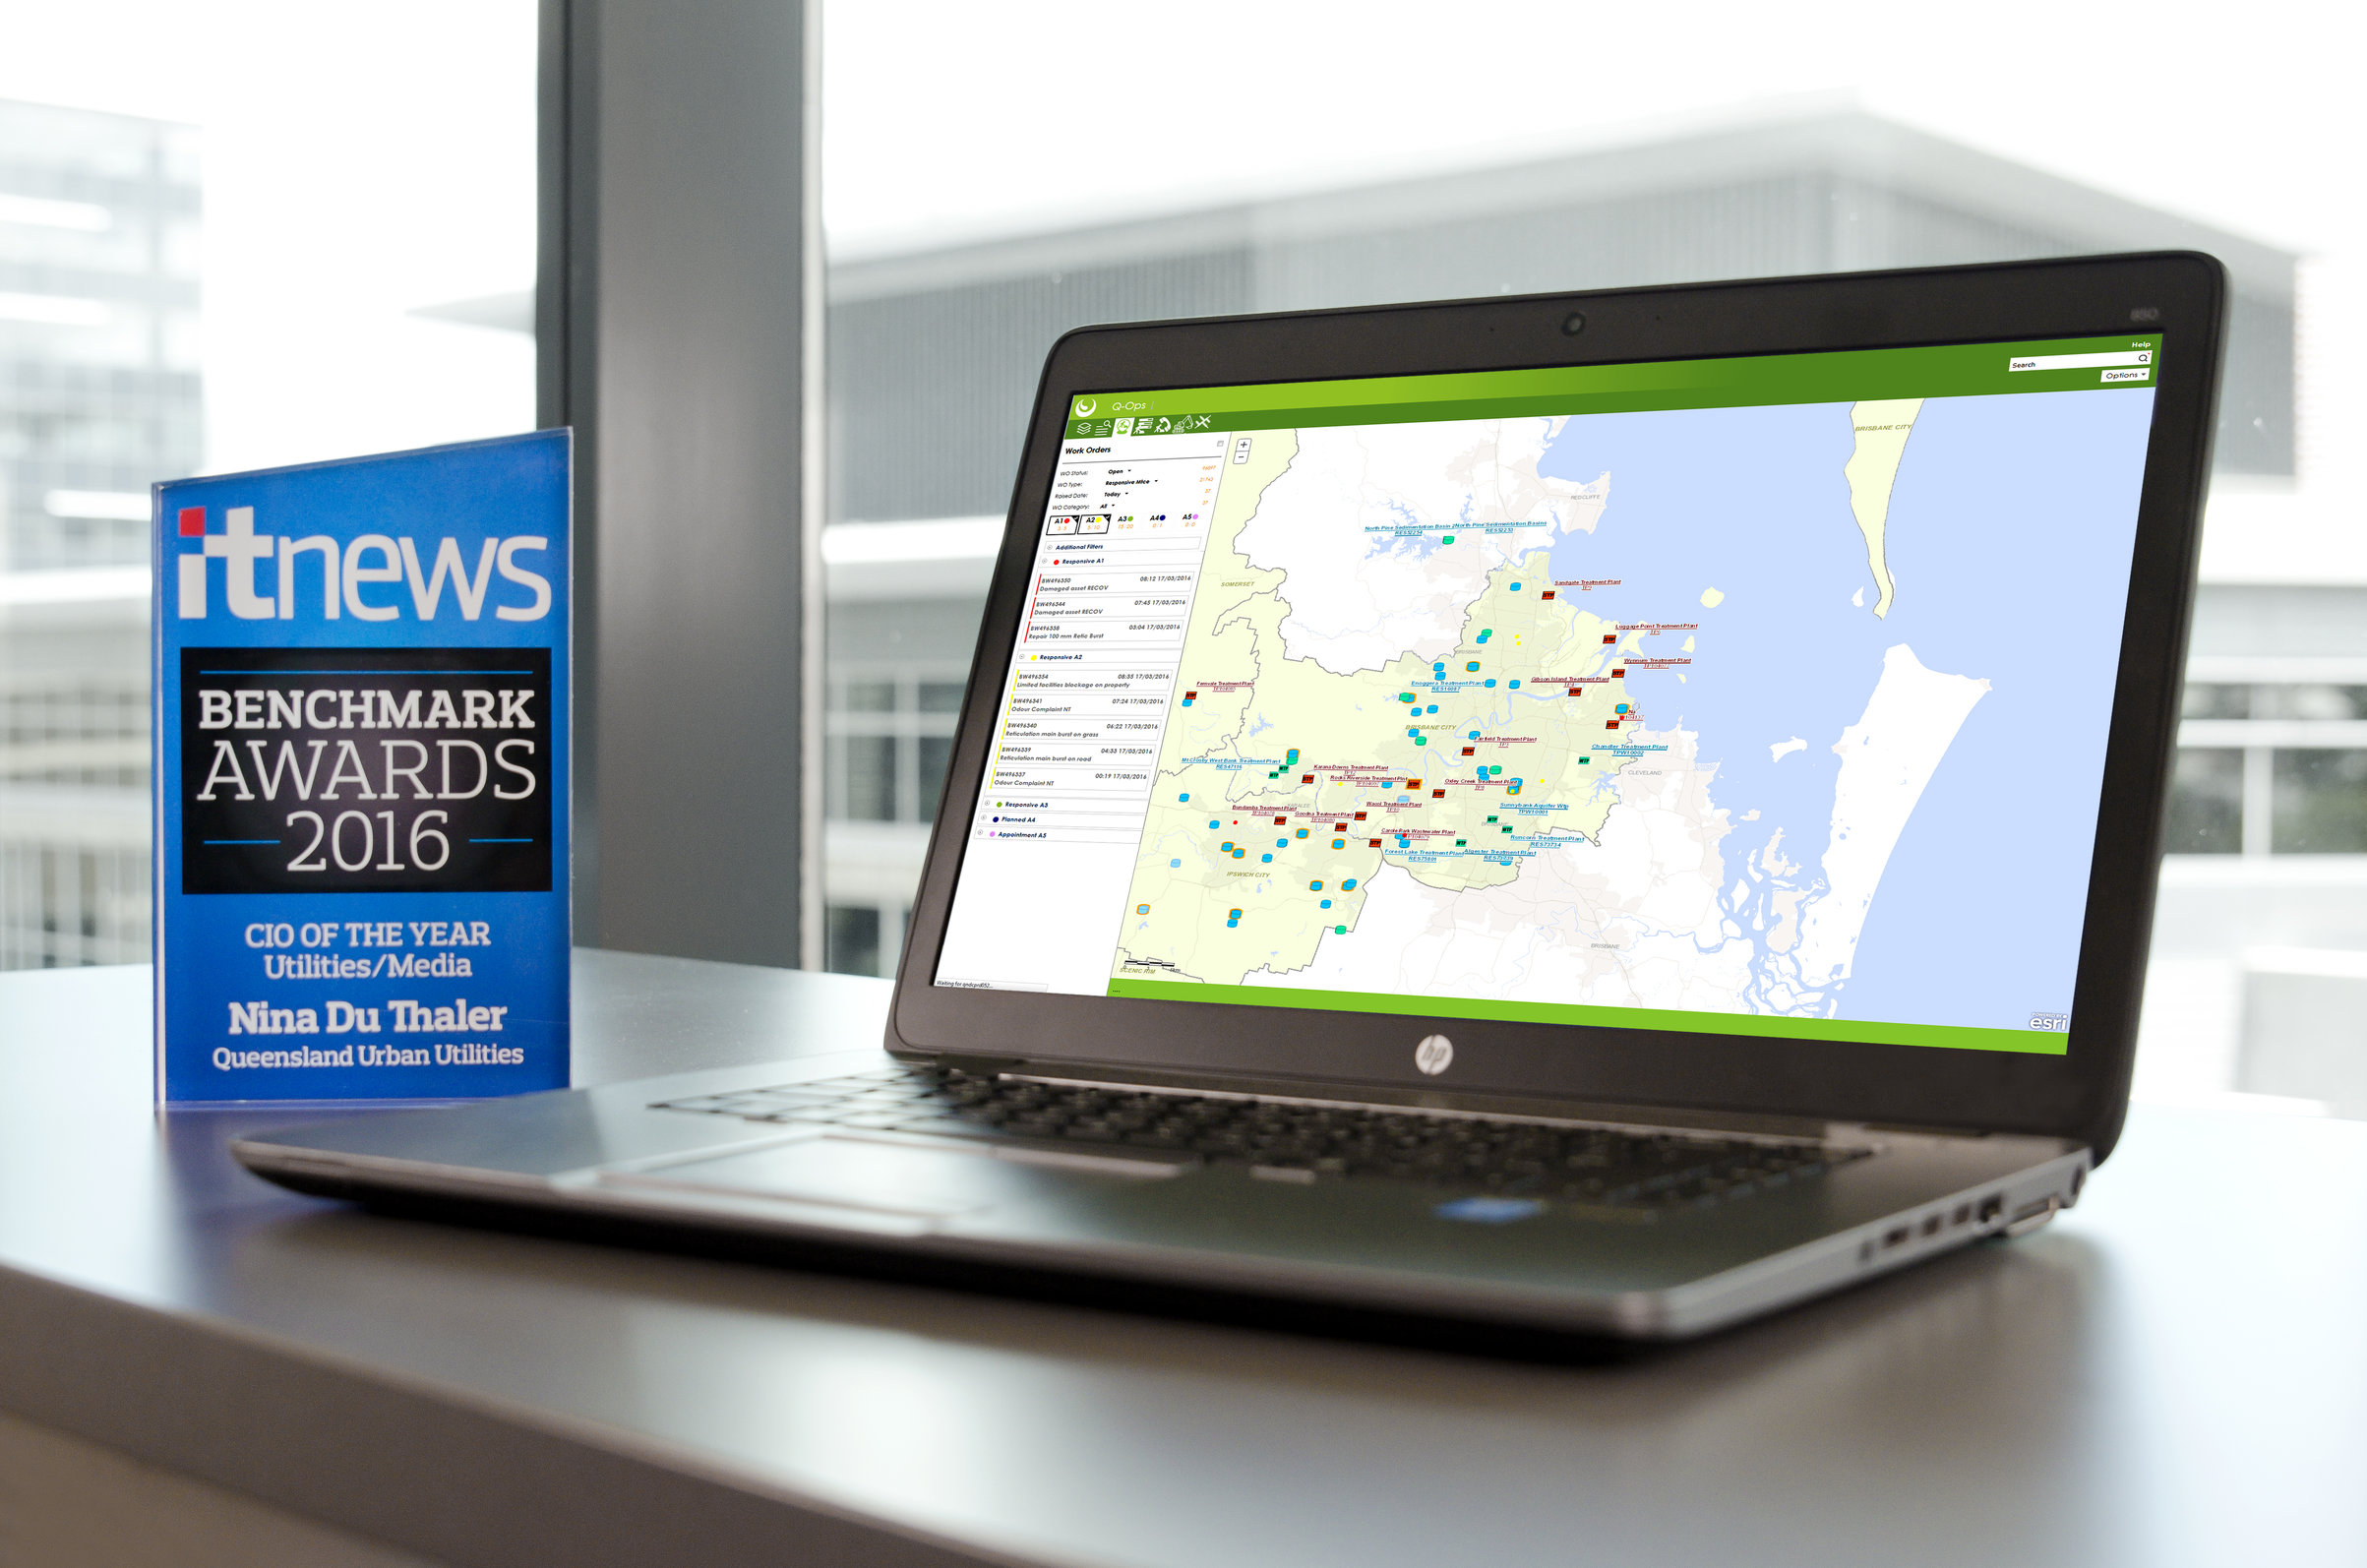
The innovation is already gaining recognition within the IT and utilities communities – QUU Chief Information Officer Nina Du Thaler was named Utilities CIO of the Year at the IT News Benchmarks Awards, which recognises technology leadership and the creative application of technical solutions to complex problems.
Du Thaler likens the appearance of the spatial maps used to present the data to maps within a refidex, with the addition of inbuilt intelligence.
“If you’ve used a refidex, if you open it up to any of the pages that have streets and parks on it, it looks similar,” she says. “We’ve got a number of different layers of digital imagery that we can use; we’ve got satellite photos, the street centre lines, the street property layer, and we can turn on and off each of those layers, and each of our jobs are displayed on top of those maps.”
Available to crews who are on-the-go through handheld, portable devices and to office staff alike, Q-Hubs allows QUU to see where crews are located and where jobs are coming in from.
“It’s a single repository and view of our world, from an asset, customers, crews and jobs basis, and it allows all the different people within our organisation to be able to view what that looks like,” Du Thaler says.
“One of the best things about is that it allows us to reuse a lot of data that’s in our legacy systems. We’re really getting the value out of our legacy systems, by bringing that information through an integration hub and into our GIS platform, and allowing people to engage with that data using location as the primary key.”
The information gleaned from Q-Hubs means QUU can trace the water and sewerage network throughout south east Queensland to better identify and locate faults on the system.
“From a contact centre point of view, we can see hot spots where we’re getting lots of customer calls for service, and that might indicate that something is going astray with our infrastructure,” Du Thaler says. “It also allows us from a customer point of view to be able to trace backwards from any of our assets. For example, if we’re going to do a planned piece of work on a particular valve or section of pipe and that means that there are going to be some homes that are without water, we can trace back our network and identify exactly who is going to be impacted and proactively contact them.”
They can then add layers to the geospatial maps that show assets, critical customers, crews and jobs.
Geographic dispatching
Q-Hubs has allowed QUU to track work vehicles as they move between maintenance jobs and dispatch the closest units to emergencies.
“We’ve moved to essentially geographic dispatching; rather than jobs being given to the next crew available or dispatching those crews from a depot, we now have the ability to geographically schedule and dispatch those crews,” Du Thaler says.
“It allows us to be a lot more proactive. You would think that we would know exactly how all our assets are linked together, which pipes join to which pipes etc. But, a lot of our infrastructure can be up to 100 years old, so quite often if we’re working on a section of a pipe, we may not know exactly which houses are serviced from it.
“In a network street infrastructure, some houses connect to a pipe behind the houses in another street, some connect to the pipework in front of the houses. With this solution, we know what’s connected to what, so if we’re expecting an outage, we can definitively trace backwards and work out the customers, and proactively engage with them either by door knocking or dropping cards into their mailboxes.”
Moving from push to pull
The Q-Hubs rollout has been gradual. There have been three releases so far, covering sewer and network tracing, bringing contact centre staff onboard, and releasing it into the emergency management space earlier this year. This multi-staged rollout has meant staff using the system are engaged rather than overwhelmed, Du Thaler says.
“We’ve done a number of progressive releases and that was part of our strategy,” she explains. “In an organisation, particularly from an IT point of view, sometimes it’s hard to demonstrate the value that can come from some of these technologies; you often hear that IT technologies are pushed upon a business.
“For us, it was about how can we build that up slowly and get our people to engage with that organically, and then get a bit of excitement around it, and really get the business saying, ‘OK, now that we’ve got the base technology, how do we extend that out?’.
“Internally, we’ve received quite a lot of good feedback, and one of the keys for me is that it’s taken it from what I call push to pull: originally at the start of the project, it was very much trying to sell the value of the technology into the business to get it started. Now, people around the business are engaging with that technology and saying, ‘Can we have this as well, can we present this type of information as well?’.
“They’re now starting to pull in their direction, which is requiring us to do further updates, and that’s great.”
The future of Q-Hubs
Du Thaler says there are exciting opportunities for future Q-Hubs updates. “Some of the technologies we’re starting to play with and trial now are around 3D rendering of that image, using virtual reality or augmented reality to be able to display that in 3D and real time,” she says.